

A brief guide to data analysis
Data analysis can be exciting and sometimes overwhelming. Approaching the project with a strategy can make the process go smoother. Mandinach and Gummer interpreted data literacy as “the collection, examination analysis, and interpretation of data to inform some sort of decision in an educational setting;” this is relevant because the data analysis process increases one’s data literacy skills. The stages in the data analysis process include:
- Identifying the objective
- Preparing and cleaning the data
- Analyzing and interpreting the data
- Sharing the data and results

Identify the objective.
Start the process by identifying the objective for your data analysis. Select an objective that is aligned with instructional improvement, such as a question that needs an answer or a situation that requires more information. Examples may include:
- How does one group of students perform compared to another group or the whole?
- Is there a correlation between semester grades and career and technical education (CTE) program retention?
Next, determine why the data needs to be analyzed. The goal could be to clarify if inequities exist; to track data that align with district initiatives; to track data that are reported to the state so that early warning systems can be set up; or to compare a school or district to another school, district, or statewide. Identify the purpose of the data, and this will help uncover what data you need to address the objective.
Start by listing all the data available that align with the objective. Readily available data could include student grades, attendance, enrollment, credits earned from transcript data, state test scores, industry certification data and/or postsecondary enrollment. Determine what other data you need to meet the objective. This could include overall school demographics, overall state data, or details about a school or district with similar demographics.
After establishing the data available and any additional needed data, establish the desired levels of aggregation or disaggregation. Levels of data can be aggregated to the program, school or district level. Data can also be disaggregated by school, program, gender, special population status, ethnicity, grade level, CTE program completion status, grade earned in class and credit earned versus attempted.
Prepare and clean the data.
This process consists of two parts: formatting the data and cleaning up the data. Formatting consists of ensuring numbers display correctly for their data type (e.g., percent, general number format, number of decimal places, dates). Text formatting entails adjusting the capitalization and removing leading, trailing, or repeated spaces before or after data entries so there is consistency. Set text in all lowercase, all uppercase or with the first letter of each word capitalized. But it should be consistent. The formatting determines how the data labels will appear when you create tables, charts or other visualizations.
Next, clean the data. Cleaning data can be the most time-consuming part of the process. Aspects of data cleaning include correcting null values and coding variables consistently. If any records contain the word “null,” and the other records have numbers, remove those or replace them with a zero, depending on how the data will be used. It’s also important to review the data to ensure variables are coded consistently. For example, code gender as “M,” “F,” and “NB,” or “Male,” “Female,” and “Nonbinary.” But don’t use a combination. Consistency will help ensure clean, reliable data and accurate visualizations.
The last step in preparing data is to remove any duplicates and create tables for data. Spreadsheet programs include several built-in features to help identify duplicates, such as conditional formatting that will highlight items that appear more than once. Most programs also have a feature that will remove duplicates.
Analyze and interpret the data.
Create a table and begin analyzing the data for trends. You may use functions in Microsoft Excel to calculate totals and averages, or descriptive statistics to calculate mean, median, mode, minimum, maximum and other overall group statistics. Identify any gaps. Dig deeper to identify driving factors for the gap(s). Getting to the root cause of a gap will help determine how to address issues of equity.
Next, create a plan. How will you address identified gaps? Interventions might include group certification testing to help with transportation needs or providing additional professional development for CTE faculty. After determining how to implement community supports, decide how to measure their effectiveness. SMART goals present an opportunity for program stakeholders to monitor and collect new data and track overall progress.
Share your data and results.
First, determine who the audience for your data will be. This may include a professional learning community, administration, counselors, community members or other CTE partners. Depending on the audience, some subgroup data may need to be suppressed to protect student privacy.
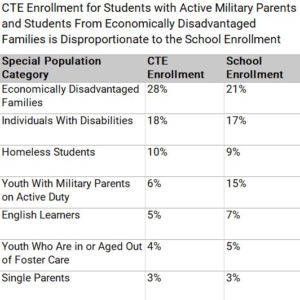
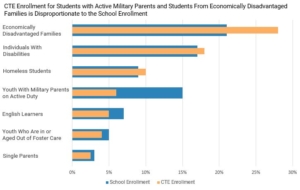
Next, select the best format for sharing data. Graphs and other visual aids often make it easier for people to understand data. Create visualizations that are clear and do not contain too much information or feature complex backgrounds. Use colors and fonts that enhance readability; the graph should convey the message without requiring the reader to perform calculations. Further, creating a descriptive title for the graph will help readers understand the main idea of the graph. Consider Figures 1 and 2. They contain the same information, displayed as a table (Figure 1) and as a visualization (Figure 2). Notice how easy it is to comprehend the differences when the data are displayed visually.
After sharing the results of your data analysis, the journey isn’t over. Determine how frequently to reanalyze the data for program improvements. Having reliable data generated on a continuous cycle can help increase student achievement and enable teachers, schools and districts to measure proposed changes. Identification, collection, analysis and visualization of data is an iterative process as schools strive to reach equity goals. Identify data objectives, create a data plan, and enjoy the data analysis process!

Michelle Crary, Ed.D., is a CTE coordinator for Gilbert Public Schools. She has spent more than 20years in CTE in several capacities including secondary teaching, adjunct faculty, staff development, and assessment >amp; accountability. Crary has a passion for data analytics and making data accessible and understandable.