Perkins Data and Reporting
Perkins, like most pieces of federal education and workforce development legislation, expects positive outcomes in exchange for funding. A major responsibility of the Perkins grant manager includes tracking data and expenditures and reporting these to the state.
In addition to the less frequent CLNA and local application, local recipients must submit Perkins enrollment and performance data each year for accountability. This data is then aggregated at the state level and submitted to the federal government through the Consolidated Annual Report.
As part of this reporting, the Perkins grant manager for the institution or district must continuously oversee budgeting and spending of funds, equipment inventory, and data collection.
ACTE has developed a checklist that explains more about the Perkins grant manager role, including reporting functions, and can help you keep track of the information and contacts needed for success.
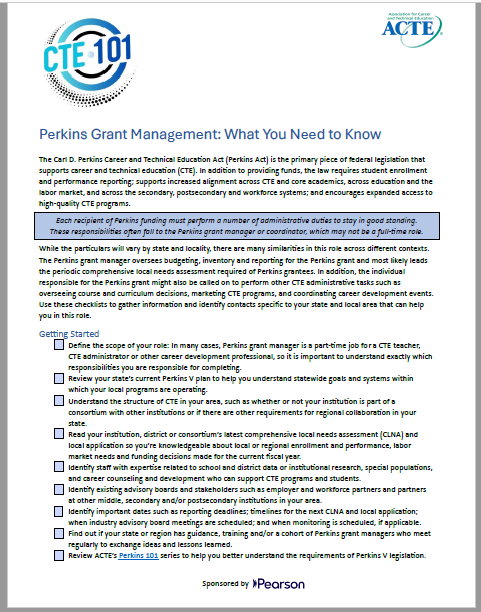
Download the “Perkins Grant Management: What You Need to Know” checklist
States and local recipients are required to report enrollment data on the following.
- CTE participants: This is defined as a student served by an eligible recipient who has completed one course in a CTE program or program of study.
- CTE concentrators: At the secondary school level, this is defined as a student served by an eligible recipient who has completed at least two courses in a single career and technical education program or program of study. At the postsecondary level, it’s a student served by an eligible recipient who has earned at least 12 credits within a CTE program or program of study or who has completed such a program, if the program encompasses fewer than 12 credits.
Each state further defines CTE concentrator; for instance, by deciding what “course” means in that state (such as 1 Carnegie unit or a set number of instructional hours) and which courses apply to a “single” program of study.
In addition to enrollment data, grantees must report the following outcomes data for CTE concentrators on the secondary level.
- 1S1: Four-year Graduation Rate: The percentage of CTE concentrators who graduate high school, as measured by the four-year adjusted cohort graduation rate defined in the Elementary and Secondary Education Act (ESEA).
- 2S1: Academic Proficiency in Reading/Language Arts: The percentage of CTE concentrators obtaining proficiency in the challenging State academic standards adopted by the State under ESEA, as measured by the academic assessments in reading/language arts required by that Act.
- 2S2: Academic Proficiency in Mathematics: The percentage of CTE concentrators obtaining proficiency in the challenging State academic standards adopted by the State under ESEA, as measured by the academic assessments in mathematics required by that Act.
- 2S3: Academic Proficiency in Science: The percentage of CTE concentrators obtaining proficiency in the challenging State academic standards adopted by the State under ESEA, as measured by the academic assessments in science required by that Act.
- 3S1: Post-program Placement: The percentage of CTE concentrators who, in the second quarter after exiting from secondary education, are participating in any one of the following activities:
- postsecondary education
- advanced training (such as an apprenticeship)
- military service
- a service program under the National and Community Service Act or the Peace Corps
- employment
- 4S1: Non-traditional Program Concentration: The percentage of CTE concentrators in CTE programs that lead to occupations in non-traditional fields (fields in which individuals from one gender comprise less than 25% of those employed, such as men in nursing or women in welding).
Finally, at the beginning of Perkins V, states selected at least one of the following three secondary program quality measures to report on each year. Local grantees must report data on the measure(s) chosen by their state:
- 5S1: Program Quality – Attained Recognized Postsecondary Credential: The percentage of CTE concentrators graduating from high school having attained a recognized postsecondary credential.
- 5S2: Program Quality – Attained Postsecondary Credits: The percentage of CTE concentrators graduating from high school having attained postsecondary credits in the relevant CTE program earned through dual or concurrent enrollment or another credit transfer agreement.
- 5S3: Program Quality – Participated in Work-Based Learning: The percentage of CTE concentrators graduating from high school having participated in work-based learning.
All data reported must be disaggregated by gender, race/ethnicity, migrant status (secondary only), and special population as well as by Career Cluster or program area. However, funding recipients are only held accountable for overall student performance.
Each state sets its own performance targets for each of these indicators. Local recipients usually accept the state-determined performance levels as their own local performance levels, have a more customized target assigned by the state, or may choose to negotiate different performance targets. If local recipients do not achieve at least 90% of a performance target in a given year, they must work with their state to develop a Perkins improvement plan.
Learn more! Check out the U.S. Department of Education Office of Career, Technical and Adult Education Perkins Data Explorer to see Perkins data in your state and across the nation.
A variety of data sources are needed to report on these measures, some of which will be provided by state sources, such as graduation data, and some that you may need to collect locally.
The most challenging measure for many local recipients to report is the post-program placement measure. If your state lacks a robust state longitudinal data system or state-level protocol for matching data across education and workforce systems, local CTE staff may need to contact alumni by survey, email or even phone to learn whether they are enrolled in further education, in the workforce or pursuing another path.
Perkins is not the only data source that administrators and teachers take into account when considering program quality, outcomes and improvement. Other sources include:
- Data on attendance and chronic absenteeism rates, often found in state report cards
- End-of-course and industry credential assessment data
- Student performance on statewide assessments
- State college and career readiness metrics
- Labor market information from state and local workforce agencies (see state-by-state resources)
Ideally, each of these data sources would also be disaggregated by student group in order to identify gaps in access and performance.

Reflection Questions
The following questions can help you think through both the information and resources you have and what you might need to help you understand Perkins data and reporting. These questions, among others, can also be found in the fillable reflection tool and are addressed with greater detail in the “Perkins Grant Management: What You Need to Know” checklist.
- What tools are available for tracking Perkins data?
- What tools are available for tracking Perkins budget and spending?
- What is the timeline for reporting Perkins data annually to your state?
- What Perkins accountability indicators apply to your district or institution and how are these indicators defined?
- What are your district or institution’s targets for student performance on Perkins accountability measures?
- What data-sharing agreements impact your Perkins reporting?
In addition, to help you consider how well data and program improvement activities are integrated into your programs, you can consult the ACTE Quality CTE Program of Study Framework®. Courses on data and reporting are also available through ACTE’s CTE Learn online course platform.